

Gender and informality in Argentina. Regional differences
Laura Golovanevsky
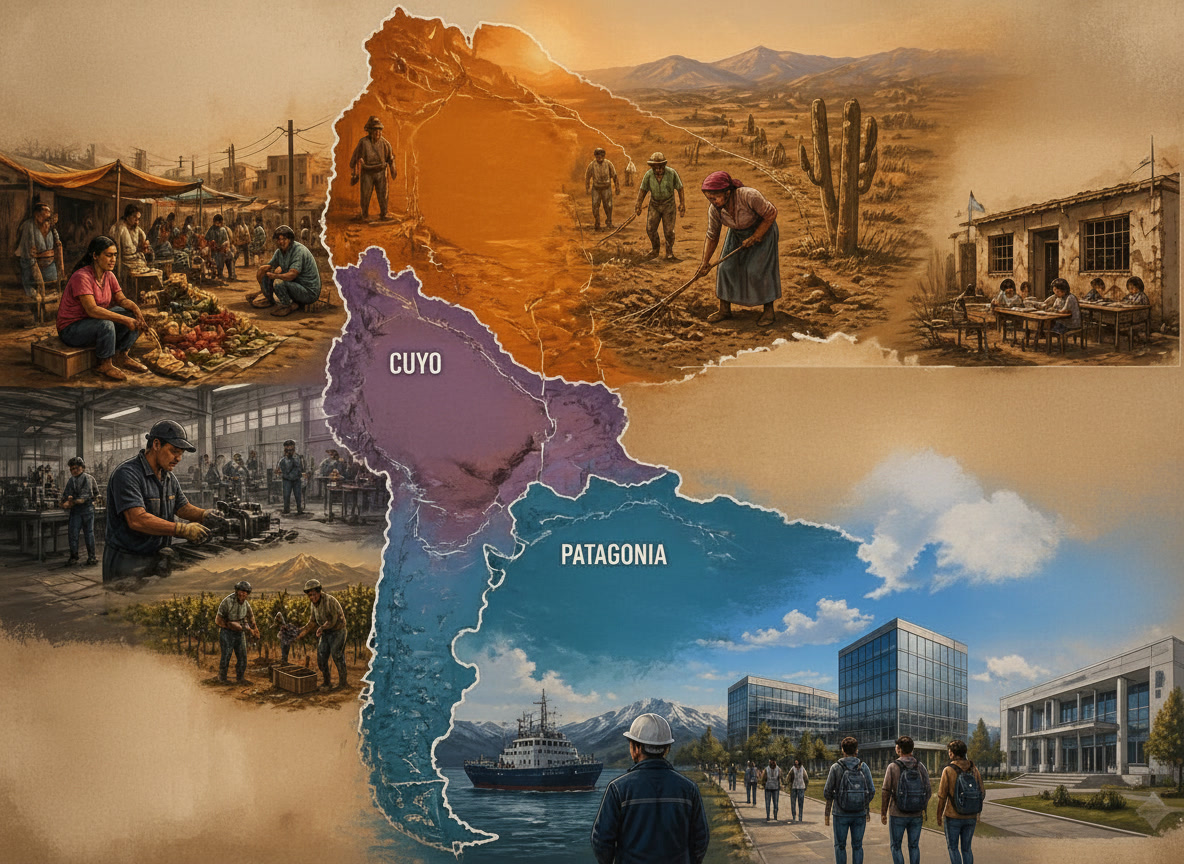
It is widely stated that women work in more precarious conditions, with lower wages and higher leves of underemployment. We wonder how this relationship is registered at regional level in Argentina (2016-2024).Argentina has a vast territory of nearly 3.7 million square kilometers, ranking only behind Russia, Canada, the United States, China, Brazil, Australia, and India. Within this enormous area, there is a diversity of climates, landforms, populations and economic activities that result in different forms of participation in and functioning of the labor market. This research, currently in progress, aims to examine regional inequalities in terms of informality and gender, initially from an exploratory perspective.
The period 2016–2024 is considered, analyzing indicators related to informality cross-tabulated by variables such as sex, region, educational level, household poverty and job incomes, using data from Argentina’s Permanent Household Survey. The analysis uses the third quarters of each year, which cover the total urban population. Temporal trajectories are also examined within a period of turbulence in the Argentine economy. There is also a multivariate multiple correspondence anlysis seeking for other relationships between variables which could be of interest.
Contrary to expectations, levels of informality are not consistently higher for women, but vary over years and regions. A change seems to have occured after pandemics, against women, but not constant or similar between regions. Other variables, such as educational and income levels, must be analyzed to find significant gender differences between those who are in the informal sector and those who are not.
Without delving into the theoretical debate on informality, this study adopts a broader definition than the mere existence or absence of registration of economic activities. Informal workers are defined to include: self-employed workers in technical, operative, or unskilled occupations; employers in occupations other than professional ones; family workers in technical, operative, or unskilled occupations; wage earners working in establishments with up to five workers who do not have contributions to social security; wage earners working in establishments with more than five workers who do not have contributions to social security; wage earners who do have contributions to social security but hold a non-permanent labor agreement, that is, those engaged in temporary work (fixed-term or task- or project-based), casual jobs (“changas”), or unstable work of unknown duration; and wage earners in domestic service.
In more recent times, the notion of popular economy has emerged. While this concept is not explored in depth here, its importance is nonetheless worth mentioning.
According to the proposed definition of informality, when observing the number of formal and informal workers by region and GDP, informality does not display an anti-cyclical behavior, as it previously did, when it used to function as a refuge sector.
In the 2016–2024 period, the Northwest (NOA) appears as the region with the highest informality rates, exceeding 60%. With similar values follows the Northeast (NEA), which surpasses 60% starting from the pandemic. Next is Cuyo region, with values vary between 54% and 58%. The country as a whole fluctuates between 50% and 55%. The region with the lowest levels of informality is Patagonia, ranging between 37% and 41%, and it is the only region to achieve figures below 40%.
According to this method of calculating informality, slightly more than half of employed workers would be engaged in informal employment.
After the pandemic, women in the Northwest (NOA) appear to be those currently experiencing the highest levels of informality, followed by men in the same region, then women and men in the Northeast (NEA), and women and men in the Cuyo region, in that order.
In summary, the northern and central-western regions are characterized by higher levels of informality, the central region by intermediate levels, and the Patagonian region by low levels of informality relative to the rest of the country.
Further analysis of other variables, such as educational attainment and income levels, is necessary to identify significant gender differences between those in informal employment and those who are not.
When informality is examined by educational level, as expected, individuals with lower levels of education exhibit the highest rates of informality. Those with completed primary education and incomplete secondary education display similar levels and trajectories, as do those with completed secondary education and incomplete tertiary education. The group with completed tertiary education clearly stands apart; nevertheless, it still exhibits informality rates between 20% and 30%.
Whereas higher levels of education once guaranteed upward social mobility, today they seem to function more as a parachute to prevent catastrophic downward mobility than as an exclusive mechanism for social advancement.
Final del formulario
Informality rates among those in the first decile of total labor income are very high, generally exceeding 90%. It is noteworthy that in the second decile, men display consistently higher levels of informality than women across all regions. Moreover, men and women in Patagonia are not the groups with the lowest levels of informality, as the generally are.
In the fifth decile of total labor income, men again show higher informality rates than women, except for men in the Buenos Aires Metropolitan Area (GBA), whose rates intersect with those of women. Nevertheless, NOA, NEA, and Cuyo remain the regions with the highest informality among women. The relatively high level of informality among men in Patagonia is striking. Even in this fifth decile—representing, one might assume, middle-income levels—informality remains above 60%.
From the sixth decile of total labor income onward, there is a clear decline in informality rates, with men consistently exhibiting higher rates than women, and with women in NOA and NEA falling below the rest—an interesting point for reflection. In the ninth decile, men once again have higher rates than women, and women in NEA show the lowest informality rates for almost the entire period.
When household poverty status is considered, informality rates are once again highest among women in NOA and NEA, followed by women in Cuyo and men in NOA and NEA, broadly confirming what is observed in the more general analyses.
Informality rates in non-poor households are higher among men in NOA, NEA, and Cuyo, followed by women in NOA and then men in Pampeana region. In other words, informality in employment appears to be higher among women living in poor households and among men living in non-poor households.
Among young people, informality rates broadly follow the same pattern as overall rates, with NOA emerging as the region with the highest levels.
Final del formulario
Among adults aged 30 to 49, it stands out that women in Patagonia once again exhibit lower informality rates than men.
Among employed adults aged 50 to 65, men in the Pampeana region show the highest informality rates, while NOA records intermediate values.
Among employed adults aged 66 and over, although there is greater volatility, it is noteworthy that the highest informality rate is observed among women in the Cuyo region.
A multiple correspondence analysis is also carried out using the database from the third quarter of 2024. The active variables included are: informal employment, region, age groups, poor household, sex, educational level, and decile of total labor income. Indigent household status and head of household are included as supplementary variables. After excluding cases with missing values, the analysis includes 15,154,334 cases.
The first three axes or dimensions are retained, explaining nearly 70% of the total variance. According to the discrimination measures, the first axis is associated with total labor income deciles, informal employment, household poverty, and educational level. The second axis is associated with educational level and age groups. The third axis is associated with total labor income deciles, sex, and educational level.
Region—precisely the variable of central interest—shows a low contribution to the first three factorial axes (as well as to the remaining five considered), making it the only active variable that does not appear to be relevant in any of the first three axes. The analysis is repeated excluding region, but the results do not appear to change significantly.
In the 1–2 factorial plane, informal employment, along with total labor income deciles and household poverty, is strongly linked to axis 1, while age groups are linked to axis 2. Educational level is related to both axes, given its diagonal position.
In the 1–3 factorial plane, the strong weight of informal employment and household poverty on axis 1 is confirmed, while sex appears linked to axis 3. Total labor income deciles and educational level are now associated with both axis 1 and axis 3.
Proximity is observed between older adults (aged 50 and over) and lower levels of education. Thus, axis 1 contrasts low and high levels of educational attainment, associating the former with informality, poverty, and older and younger workers. It also contrasts lower and higher deciles of total labor income.
Axis 2 contrasts men and women, as well as younger individuals and older adults. On this axis, although with limited strength, regions with higher informality (NOA, NEA, Cuyo, and in some cross-tabulations, the Pampeana region) also appear to be opposed to regions with lower informality (GBA and Patagonia).
Overall, the first factorial axis seems to represent formal, non-poor, non-indigent workers with completed secondary education or higher, in contrast to informal, poor, indigent workers with incomplete secondary education or less. However, the dichotomy between low and high educational levels appears to be better captured by the second factorial axis.
The factorial plane defined by axes 1 and 3 appears to confirm the patterns already observed. Axis 3 seems to separate GBA and the Pampeana region from the rest of the regions.
Finally, the factorial plane defined by axes 2 and 3 clearly separates men and women, low and high levels of education, and axis 3 again appears to distinguish GBA and the Pampeana region on one side from the rest of the regions on the other.

International Network for Knowledge and Comparative Socioeconomic Analysis of Informality and the Policies to be Implemented for their Formalization in the European Union and Latin America
Horizon Europe Project 101182756 — INSEAI 2023